Galaxy UX Studio
  • Servicesdrop down icon
    • AI-Driven UX Research
    • Product and UX Design
    • Enterprise DesignOps
    • Performance and Accessibility
    • UI and Visual Design
    • Assistance Services for Agencies
  • Case Studies
  • Insights
  • About Us
  • Contact Us
Request a UX Audit

Empowering smarter, greener driving

A mobile-first EV experience bringing vehicle management, performance, maintenance, and community into one intuitive platform. The experience simplifies complex vehicle information and prioritizes the actions drivers need most.

Explore all 4 case studies in this series

+55%

Driver Engagement

+45%

Task Clarity

+40%

Feature Adoption
CLIENT
B-ON
TIMELINE
12 months overall engagement
TEAM
UX Designer, UI Designer, Product Designer, UX Writer

Services Used

UX Research & Discovery UI & UX DesignInformation Architecture 
netgear engage

The Challenge

Making complex EV information simple and actionable 

The B-ON experience needed to bring vehicle information, performance, maintenance, alerts, and community features together without overwhelming drivers. 

The challenge was to create a clear, intuitive experience that helped drivers understand their vehicle, prioritize actions, and engage with the platform more confidently. 

Key Pain Points 

  • High Feature Density
    Multiple vehicle and engagement features needed clearer organization. 
  • Complex Vehicle Data
    Performance and vehicle information needed to be easier to understand. 
  • Unclear Task Prioritization
    Drivers needed clearer next steps across the experience. 
  • Balancing Utility with Community
    Practical vehicle management needed to coexist with community engagement. 
  •  Long-Term Product Scalability
    The experience needed reusable foundations for future product growth. 

Research & Discovery

Understanding Driver Needs

Understanding Driver Needs

Research combined user interviews and platform analytics to understand how drivers interacted with the product and where the experience created friction.

User Interviews 24 participants
Age22–45
Users92% mobile users
Analytics Review 60K+ sessions
Analysis Period 6 months
Observed Drop-Off65% 
Experience Analysis

Understanding Feature Expectations

The research focused on vehicle information, performance and maintenance guidance, and engagement opportunities.

Vehicle InformationNeed for one centralized experience
PerformanceNeed for clearer guidance
MaintenanceNeed for clearer action-oriented information
EngagementInterest in gamification and progress tracking

Key Research Findings

58%

Wanted one place for vehicle information

46%

Needed clearer performance and maintenance guidance

42%

Showed interest in gamification and progress tracking

Before & After

After

Before

Before

Disconnected ideas and unstructured feature grouping.

Click to view full screen

After

A cohesive driver experience with clearer navigation and prioritized actions.

Click to view full screen

Before

Vehicle and performance information created complexity.

Click to view full screen

After

Information was organized around driver priorities and easier-to-understand actions.

Click to view full screen

Our Solution

We created a mobile-first EV management experience that organizes vehicle information, maintenance, performance, and community features around the driver’s priorities. 

Guided Onboarding Experience
Simplifying the Driver Experience

Vehicle information, alerts, performance, and community features were organized around driver needs. 

Integrated Support Access
Prioritizing Actions

Clearer information hierarchy helped drivers identify important tasks and next steps. 

Smart Update Notifications
Simplifying Information

Complex vehicle and performance information was presented in a more accessible structure. 


Measurable Impact

Onboarding Completion
+55%

Driver Engagement

The redesigned experience encouraged more active and repeat interactions.

Before:Passive usage
After:Active, repeat interactions
Support Friction
+45%

Task Clarity

Clearer information hierarchy helped users understand what to do next.

Before:Feature confusion
After:Clearer next steps
Workflow Efficiency
+40%

Feature Adoption

Improved organization increased usage across multiple app modules.

Before:Lower feature usage
After:Increased module adoption
Time to Feature Discovery
+38%

Maintenance Alert Responsiveness

Clearer alerts helped move users from missed updates toward more timely action.

Before:Missed updates
After:More timely action
Overall Usability Score
+35%

Community Interaction

Community features supported more active interaction between drivers.

Before:Minimal engagement
After:Active driver connections
User Engagement & Retention
+30%

User Satisfaction

The simplified experience increased confidence and satisfaction.

Before:Lower satisfaction
After:Higher confidence and satisfaction

Methodology & Testing

User Story–Led Design

User Story–Led Design

Features and workflows were mapped to real driver needs.

Iterative Prototyping

Iterative Prototyping

Interaction models were explored and refined through multiple iterations.

User Testing

User Testing

Designs were validated for usability, adaptability, and overall experience.

testimonial-element-top
“The app brings together everything a driver needs in one intuitive experience.”
B-ON Team

B-ON Team

Key Learnings & Insights

Structure Reduces Complexity

The more features a product has, the more important information hierarchy becomes.

Engagement Needs Purpose

Progress, feedback, and meaningful interactions can encourage sustained engagement.

Alerts Should Drive Action

Notifications work best when they are timely, relevant, and easy to understand.

Design Systems Support Growth

Reusable components create consistency while making future expansion easier.

Design Process Deep Dive

Discovery & Research

Discovery & Research

User interviews and platform data analysis helped identify driver needs, behavior, and friction points.

Ideation & Prototyping

Ideation & Prototyping

Insights were translated into structured journeys, information architecture, wireframes, and interactive prototypes.

Testing & Validation

Testing & Validation

Usability testing, prototype testing, data-driven evaluation, accessibility validation, and design QA supported iterative refinement. 

Implementation & Handoff

Email Icon

Design Finalization

Final interfaces were refined through iterative validation and design QA. 

Phone Icon

Specification Sharing

Reusable components, patterns, and design specifications established consistent implementation guidance. 

Office Icon

Developer Collaboration

Design and development requirements were aligned through structured handoff and collaboration.

Developer Handoff Process

Documentation

Design specifications and reusable patterns were documented for implementation.

Components

A Figma component library supported consistent interface development.

Assets

Reusable design assets and patterns were prepared for implementation.

Collaboration

Design and development teams collaborated throughout finalization and handoff.
icon top.svg
icon top.svg
icon bottom
icon bottom

Ready to Transform Your Conversion Rates?

See how we can apply similar strategies to your product. Let's discuss your conversion optimization challenges and explore proven solutions.

hand icon
Talk to an ExpertRequest a UX Audit

Share This Case Study

Found this case study helpful? Share it with your network.

Share on LinkedInShare on Twitter

Get More Case Studies

Want Similar Results for Your Product?

Our team of UX experts is ready to help you achieve measurable improvements in your conversion rates and user satisfaction. Let's discuss your specific challenges and goals.

Email Icon

Free Consultation

30-minute strategy session to discuss your goals

Phone Icon

UX Audit

Comprehensive analysis of your current experience

Office Icon

Custom Strategy

Tailored approach based on your unique needs

Schedule Free ConsultationRequest a UX Audit

No commitment required. Let's explore how we can help you achieve similar results.

Awards & Recognition

INC 5000
Clutch
Viva Pulse
Forbes 100

Locations we
are in

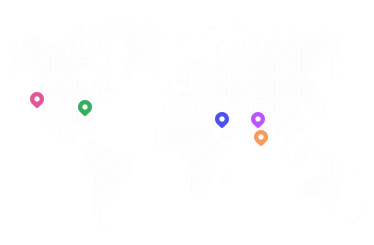
Galaxy UX Studio Map

United States

San Diego

Galaxy Weblinks, Inc. 3526 Buck Ridge Ave, Carlsbad CA, USA 92010

Boston

Galaxy Weblinks, 25 Main St, Suite B North Reading, MA 01864

UAE

Dubai

Galaxy Weblinks, UAE, Capital Building RAKEZ FTZ, Business Park, R3, Al Hamra, Ras Al Khaimah, United Arab Emirates

India

Indore

Galaxy Weblinks, 307 Bansi Trade Center, Indore, MP, India 452001

Madurai

Galaxy Weblinks, Elcot IT Park, Illanthai Kulam, Madurai, TN, India 625020

Enterprise-grade UX design that drives measurable business results. Transforming digital experiences through data-driven design and AI-powered insights.

Service

  • AI-Driven UX Research
  • Product and UX Design
  • Enterprise DesignOps
  • Performance & Accessibility
  • UI and Visual design
  • Assistance Services for Agencies

Company

  • Case Studies
  • Insights
  • About
  • Contact

Other

  • Request a UX Audit
  • Podcast
  • instagram
  • linkedin
  • dribbble
  • youtube
  • Galaxy UX Studio Logo
  • Galaxy Edge Logo
  • Galaxy UX Studio Logo

© 2026 Galaxy UX Studio. All rights reserved

  • Privacy Policy
  • Data Compliance